When Feel Doesn't Match Real
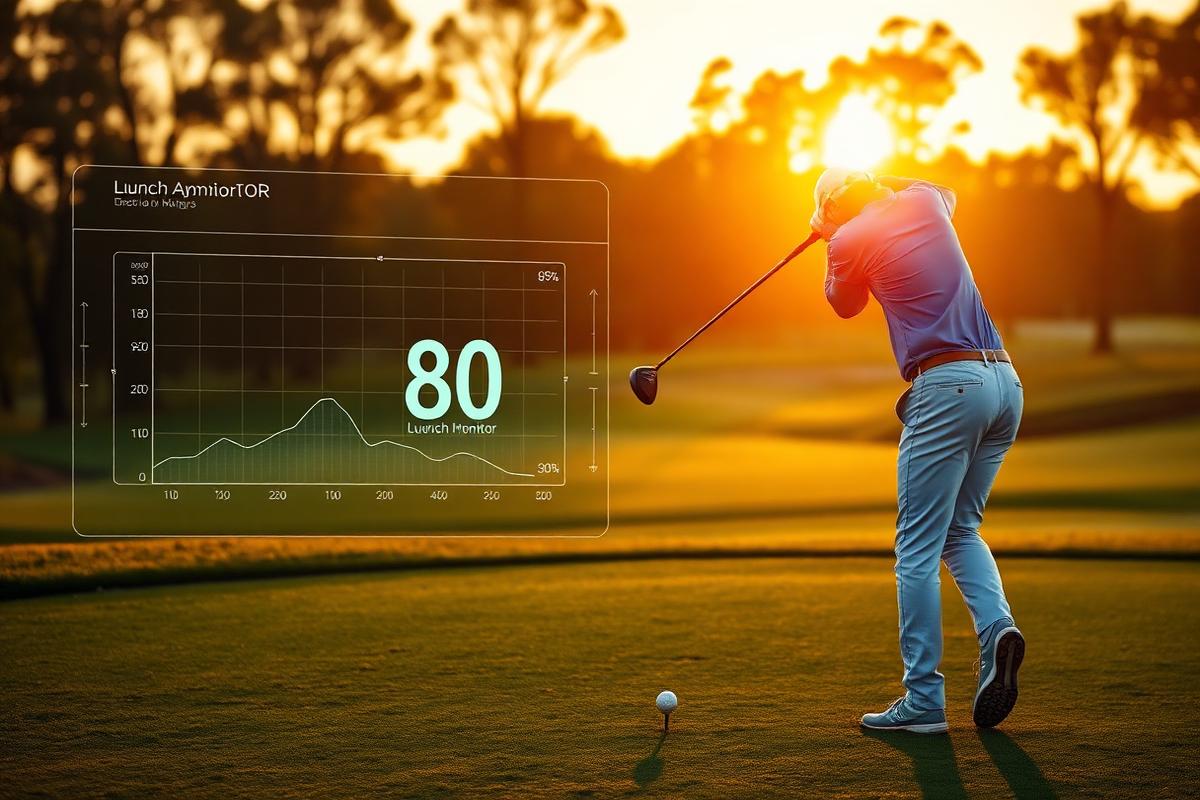
Every golfer has a story about the shot that "felt perfect" but went sideways. Or the ugly swing that somehow produced a great result. The gap between what you feel and what actually happens is one of the biggest obstacles to improvement — and it's exactly where launch monitor data changes the game.
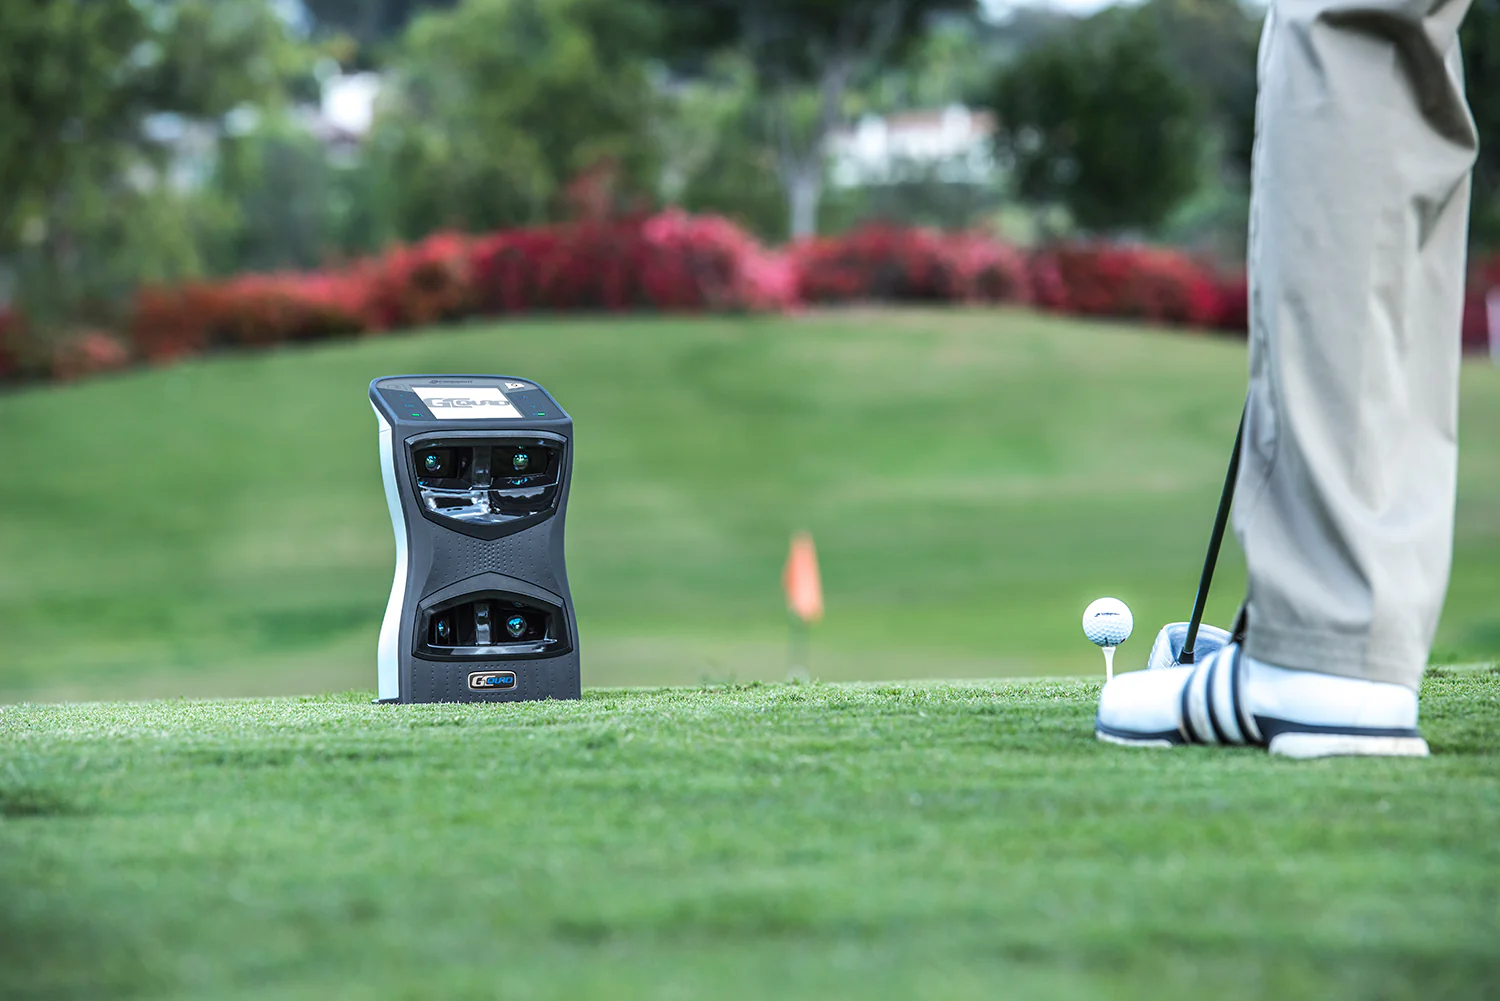
At Beyond Golf Performance, we use launch monitors in every lesson. Not as a gimmick or a selling point — as a diagnostic tool that reveals what the naked eye and gut feel simply can't.
What a Launch Monitor Actually Measures
A quality launch monitor captures data at two critical moments: impact and launch. Here's what we're tracking:
Each number tells a piece of the story. Together, they tell the whole story.
Student Story #1: The Distance Mystery
A student came to us frustrated that he couldn't hit his driver past 230 yards despite feeling like he was swinging hard. His buddies were hitting it 260+ and he couldn't figure out the gap.
The launch monitor revealed the issue in seconds: his spin rate was over 3,500 RPM with a launch angle of 8 degrees. He was hitting a low-spinning rocket that ballooned and fell out of the sky. His club head speed was actually solid at 102 mph — the energy was just being wasted on the wrong launch conditions.
We adjusted his tee height and attack angle to launch higher with less spin. Within one session, he was carrying 250 with the same swing speed. No mechanical overhaul. Just data-driven optimization.
Student Story #2: The Consistency Gap
Another student hit the ball well on the range but couldn't break 85 on the course. She assumed it was a mental game issue. The data told a different story.
Her iron shots showed a 15-yard carry variance with the same club. Sometimes her 7-iron went 145, sometimes 130. The culprit was inconsistent strike location — some shots were thin, some were heavy, and the spin rates reflected it. Shots off the center of the face spun 6,000 RPM. Heel strikes spun 7,500+.
We focused entirely on strike quality using impact tape alongside the launch monitor. Once her strike became consistent, her distance gapping tightened up and her on-course scores dropped by four strokes within a month.
Student Story #3: The Fitting Revelation
A third student was playing with a set of irons that had standard lofts and stiff shafts. He'd been fitted years ago and assumed they still worked. The launch monitor showed his 6-iron was launching at 12 degrees with 4,800 RPM — way too low with too little spin to hold a green.
His swing had changed since that original fitting. He'd gotten stronger, his attack angle had steepened, and the shaft was no longer matching his delivery. We re-fitted him into a shaft with a slightly softer tip and adjusted lofts to optimize his launch window. Same swing, dramatically different ball flight.
Why Data Beats Guesswork
Without launch monitor data, all three of those students would have chased the wrong solutions. The first would have tried to swing harder. The second would have bought a mental game book. The third would have kept wondering why his irons didn't perform.
Data removes opinion from the equation. It doesn't matter what a swing looks like from the outside — what matters is what happens at impact and how the ball responds. That's measurable, repeatable, and actionable.
How We Use It at BGP
Every lesson at BGP starts with baseline data. We establish your current numbers, identify the biggest gaps between where you are and where optimal performance lives, and build a plan to close those gaps. The data follows you — your Student Dashboard tracks trends over time so you can see real improvement, not just feel it.
Whether you're chasing distance, tightening dispersion, or optimizing your equipment, launch monitor data is the fastest path to answers.